 by Jack Dougherty
(c) Connecticut Explored Inc. Summer 2019
Subscribe/Buy the Issue!
What explains the striking disparities between wealthy and working-class families across Connecticut’s cities and suburbs today? Multiple factors created metropolitan inequalities, but to some the most surprising is the central role played by the federal government.
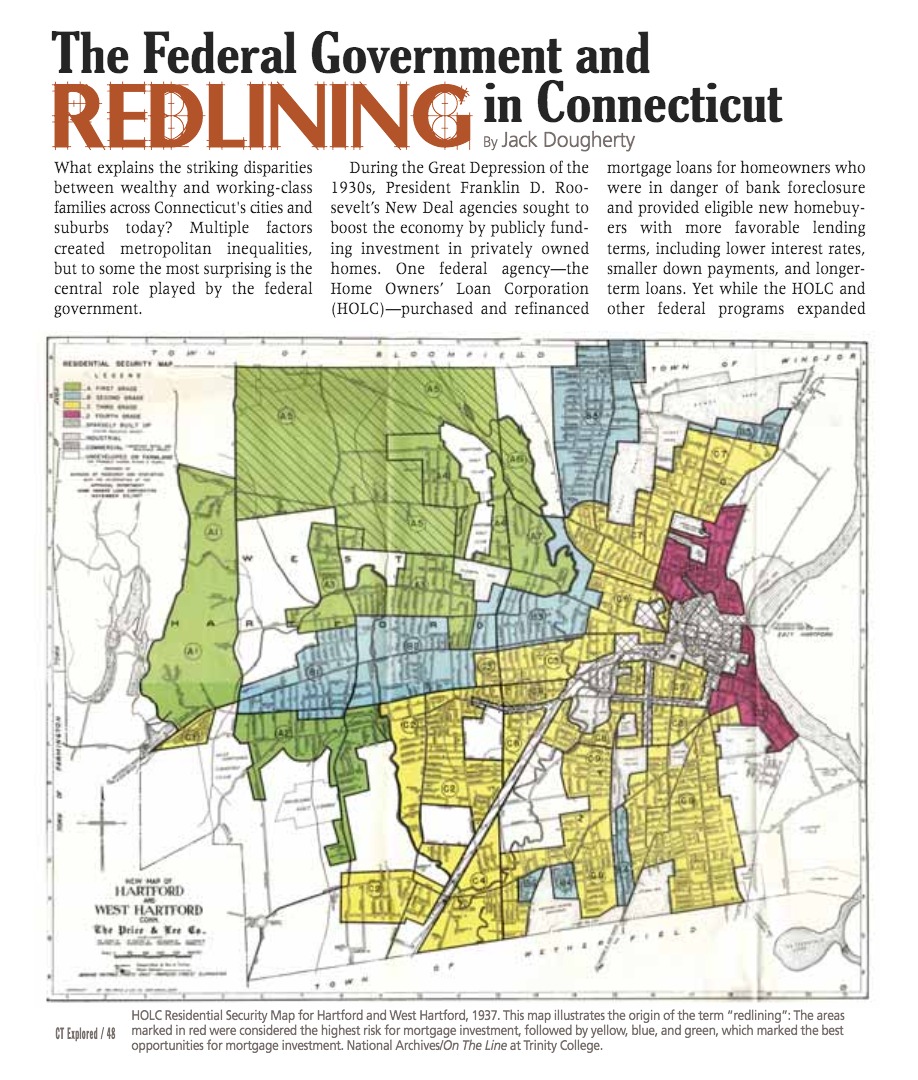
During the Great Depression of the 1930s, President Franklin D. Roosevelt’s New Deal agencies sought to boost the economy by publicly funding investment in privately owned homes. One federal agency—the Home Owners’ Loan Corporation (HOLC)—purchased and refinanced mortgage loans for homeowners who were in danger of bank foreclosure and provided eligible new homebuyers with more favorable lending terms, including lower interest rates, smaller down payments, and longer-term loans. Yet while the HOLC and other federal programs expanded home ownership to millions of Americans, they also created rules that unfairly favored upper-class white families over lower-class black and immigrant families. Rather than rate investment risks for individual applicants and their properties, federal agencies institutionally discriminated against entire neighborhoods based on their racial, ethnic, and social-class demographics. The HOLC’s color-coded neighborhood investment maps symbolize what today we call “redlining”: discrimination in offering financial services based on a person’s residence, typically linked to their race or ethnicity.
In 1937 the HOLC City Survey Program sent its field agent, Foster Milliken Jr., to meet with Hartford’s banking and real estate business leaders to assess the risk of mortgage lending in neighborhoods across the city and its developing suburbs, such as West Hartford and East Hartford. Milliken collected information for his confidential report, and HOLC staff created a four-color Residential Security Map to illustrate four levels. Green marked HOLC’s top-rated areas as the best opportunities for banks to invest in home mortgages, followed by blue, yellow, and red at the bottom.
What factors determined these neighborhood ratings? Although HOLC guidelines considered the physical condition and market price of the housing stock, they also gave strong weight to the “social status of the population,” based on the dominant standards of racial superiority and economic privilege at the time. For each neighborhood, Milliken reported the percentage of “Foreign-born” and “Negro” families, as well as “Relief families” who received Depression-era federal income assistance.
Milliken commented on specific neighborhoods, which he most likely heard from local bank and real estate leaders. In suburban West Hartford (map area A-2), he noted that a newer housing development attracted “minor executives and businessmen” and approvingly added that “a stream separates this section from its less desirable neighbor,” referring to an adjacent West Hartford area (C-2) with an “infiltration of mixed foreign” families in “workingmen’s homes.” In the North End of Hartford, Milliken described the Blue Hills neighborhood (B-5) as “largely given over to the Hebrew race although the better class [of]Italians are now also moving there.” In the South End neighborhood that was nearly all-white (C-9), he noted that a small percentage of “Negro families are confined to Roosevelt Street” and added that “lenders suggest caution in the selection of loans.” But all of these neighborhoods were rated above the red-colored area immediately north of downtown (D-1), described as “the city’s oldest residential section, which has gradually drifted into a slum area now mainly occupied by Negroes.” In this way, the invisible color and class lines in the minds of Hartford’s financial leaders were transformed into a visible color-coded map, endorsed by the federal government, yet hidden from public view.
Academics and activists rediscovered HOLC’s redlining maps in the 1980s, and, more recently, digital historians have published about 200 of those maps online. Redlining maps of Hartford, West Hartford, and East Hartford are available on the On The Line website (http://OnTheLine.trincoll.edu), and the Mapping Inequality Project (http://dsl.richmond.edu/panorama/redlining) produced a national collection that includes maps of New Haven, New Britain, Stamford, Darien, and New Canaan. While the maps of Bridgeport, New London, and Waterbury have not been digitized, they reportedly exist in the collections of the National Archives.
 As scholars closely analyze these maps and related data, new questions emerge about HOLC’s intent versus observable effects. Some argue that while the maps and reports reveal discriminatory intent, other federal programs of the era (such as Federal Housing Administration mortgages) may have played a greater role in racially and economically segregating metropolitan America. By 1968, the federal Fair Housing Act officially banned redlining in the real estate industry, but these practices were often replaced by other discriminatory barriers that attempted to disguise racism, or make it less explicit. In any case, city/suburb inequalities that exist in Connecticut today did not arise simply through the actions of biased individuals but rather were systematically incorporated into public policies that have privileged upper-class white suburban homeowners.
Jack Dougherty and his students at Trinity College are producing an open-access book, On The Line: How Schooling, Housing, and Civil Rights Shaped Hartford and its Suburbs, available at http://OnTheLine.trincoll.edu.
Explore!
Listen to Grating the Nutmeg, episode 43, “The Challenge of Fair Housing in Connecticut’s Suburbs,” featuring Dr. Jack Dougherty and Dr. Tracey Wilson. Ctexplored.org/Listen
“How Segregation Happened in West Hartford,” Summer 2019